Serverless architecture sounds awkward when you hear it for the first time. One might think.
– Hold on! So, how to execute my code? There’s no server, really? Where is the catch?
This article describes our experience we gained during our recent adventure with AWS Lambda – the serverless architecture solution.
Short introduction to the serverless concept
Serverless architecture (also known as a function as a service – FaaS) is really a straightforward concept. The developer still writes the code (in AWS terminology it is called function) but the way and the place where the code is executed are different to what we got used to. It is some ephemeral compute power that exists somewhere in the cloud. The author of the code is responsible for the business logic and the cloud provider is responsible for scaling the solution, its robustness, and maintenance. The function provided by the developer is executed on demand, and usually, it is triggered by some event. The function should be written in a stateless style, and should not rely on the previous state. All functions have the timeout after which the execution is terminated. The event may come from HTTP request, database, disk storage, device or another function etc. AWS provides a really wide range of possible event sources. The end user is charged based on used resources: execution time, reserved memory, numbers of requests, traffic etc.
If the function is not called often, then this approach may be more cost-effective than holding a dedicated server.
Use case
Our story goes back to the end of December 2016. Our new articles serving middleware consists of many microservices. One of them is responsible for transformation, storing and serving the burnt front pages (usually the main pages whose layout is set by the editors in the tool called DrFront). Due to some problems with that service, we decided to divide it into two parts and to try something new. Experimenting and getting fun is always appreciated.
The first or remaining part was supposed to serve the front (as is), while the second part which transforms and stores the front pages was meant to eventually become a function. Because this function is connected with the front burning process it was called the burner.
A typical scenario starts when the editor approves the content and the layout of the page and pushes Burn button. Next, the DrFront tool does its internal job, and once it is finished it can notify external tools by submitting the HTTP GET requests. And here our function gets a notification and enters the game. For us a natural choice was to use AWS API Gateway to accept such a request and trigger Lambda function with received arguments.
A general algorithm for the function is as follows:
- Accept and validate parameters
- Download the front page document – from the external endpoint
- Parse it and download items connected with the main document: CSS, images, XML files etc – external endpoint too
- Transform document(s) and store all deliverables in S3 bucket
- Purge caches – internal service, asynchronous call
- Send notification via SNS to the interested 3rd party systems
From the historical traffic data, we knew that the function would be called up to 100 times a day. All steps would take up to 20 seconds on average. The existing Spring Boot application had been written in the Groovy language.
Implementation
The code had already been deployed to production, so the first step was to setup a new repository, create a new project and establish a basic interface of a new function. AWS Lambda SDK provided us with simple, yet very helpful generic interfaces.
To start new Lambda function handler you can implement RequestHandler interface:
class BurnHandler implements RequestHandler<FrontBurnEvent, Integer> {

    @Override
    Integer handleRequest(FrontBurnEvent input, Context context) {
        LambdaLogger LOG = context.getLogger()
        LOG.log("Event properties: " + input)
        ....
        // Business logic here
        ....
        return 200
   }
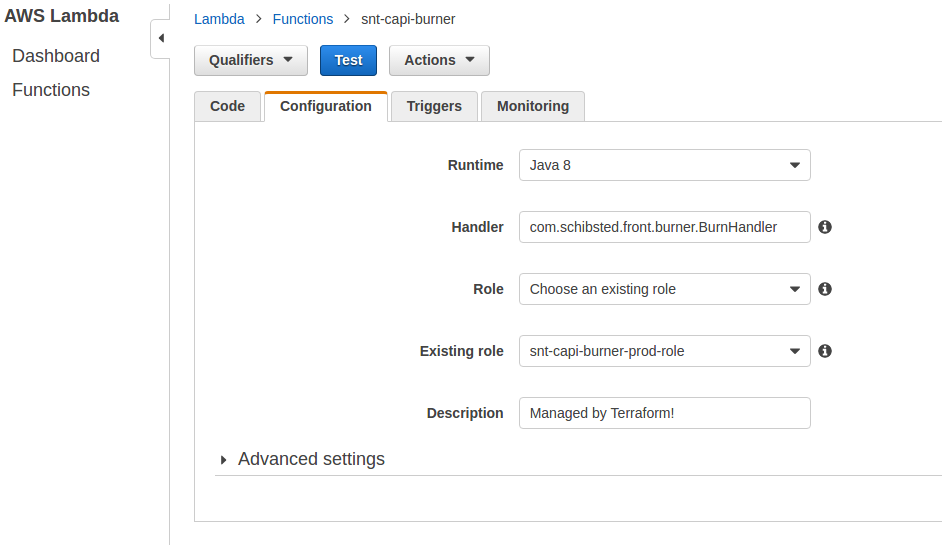
Later on, when you create the Lambda function, just indicate your class as main function handler, see below.

As you can see, my function accepted some FrontBurnEvent object (POJO – real parameters) and returned Integer. The context object passed as a second parameter allowed us to obtain some additional information about the function, for example: log stream ID, remaining time, version, logger instance etc. Access to Lambda environment variables could be achieved by a simple call:
System.getenv("ENV")
The next step was moving the existing source code to the new repository and some dry runs. First tests revealed the unpleasant thing – the startup time. Spring context initialization took around 10 seconds and the full execution time was about 30-40 seconds. In the environment where we pay for execution time, it really does not pay off.
Solution? Simple – get rid of Spring and construct all objects manually using the new operator. After that, the whole execution time was reduced to 15 seconds. The code was refactored and adapted to the stateless style. All internal caches – previously used to speed up serving functionality – were removed. Some minor bugs were fixed and after some time the function was ready. It could be run on a laptop and it did what was expected. Success! It was time to move further – to Lambda runtime.
Runtime environment
The first attempt was made in our DEV environment. Soon it turned out that it is not a trivial task. Permissions, policies, new security rules were ahead of us. First of all, the function required access to both internal (AWS) and external services. It meant that our VPC configuration had to be altered. We had to add and/or reconfigure Internet Gateway, NAT, subnets, S3 endpoint, routing tables and role policies. Another problem was the access to S3 bucket. A quick investigation and the right policy applied to the Lambda role opened yet another door. Missing permission to access the SNS topic was the last thing.
While solving these problems, our function had been reaching the timeout many times and we realized that the maximum timeout imposed on API Gateway was 30 seconds. At that time we knew that it was a hasty decision but we decided to abandon API Gateway as an event source. Instead, existing microservice was used as the function trigger. It received HTTP GET request and used Lambda client to call the function.
BurnFunction functions = LambdaInvokerFactory.builder()
.lambdaClient(AWSLambdaClientBuilder.defaultClient())
.build(BurnFunction.class)
Integer result = functions.burnFront(event)
LOGGER.info("Updating front via lambda returned $result")
Please take a look at the binding between a function and interface via @LambdaFunction annotation:
public interface BurnFunction {
    @LambdaFunction(functionName = "my-function-name")
    Integer burnFront(FrontBurnEvent event);
}
All the magic is done in LambdaInvokerFactory builder which builds a remote proxy of the given interface to make calls to AWS Lambda.
Delivery pipeline
All these configuration steps, mentioned in the previous section, were done manually. It was time to move them to Terraform and the production environment. Our fantastic DevOps crafted a beautiful GoCD pipeline which does all the tedious tasks needed to put the function in AWS eco-system. As a developer, I only need to push changes to the Git repository. The compiled package is moved to S3 bucket and the function is updated. The whole procedure takes less than a minute.
Monitoring
- CloudWatch
Tracking logs coming from the Lambda function is somewhat different than a traditional approach, where apps usually write their logs to files. By default, logs go to CloudWatch Logs and can be found in the AWS online console.
AWS command line interpreter (CLI) can also be very useful if we are looking for some pattern in logs. Below you can find an example command that looks for “some word“:
aws logs filter-log-events --log-group-name /aws/lambda/snt-capi-burner --filter-pattern "some word"
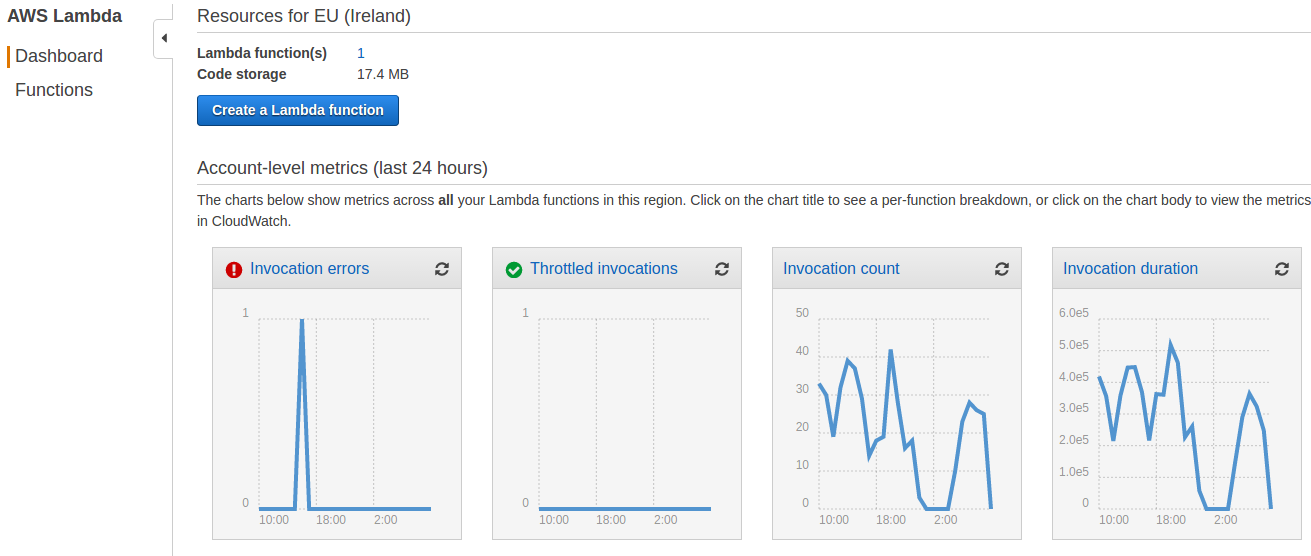
Lambda also exposes some metrics which are visualized in the Lambda Dashboard. See screenshot below.
- Datadog
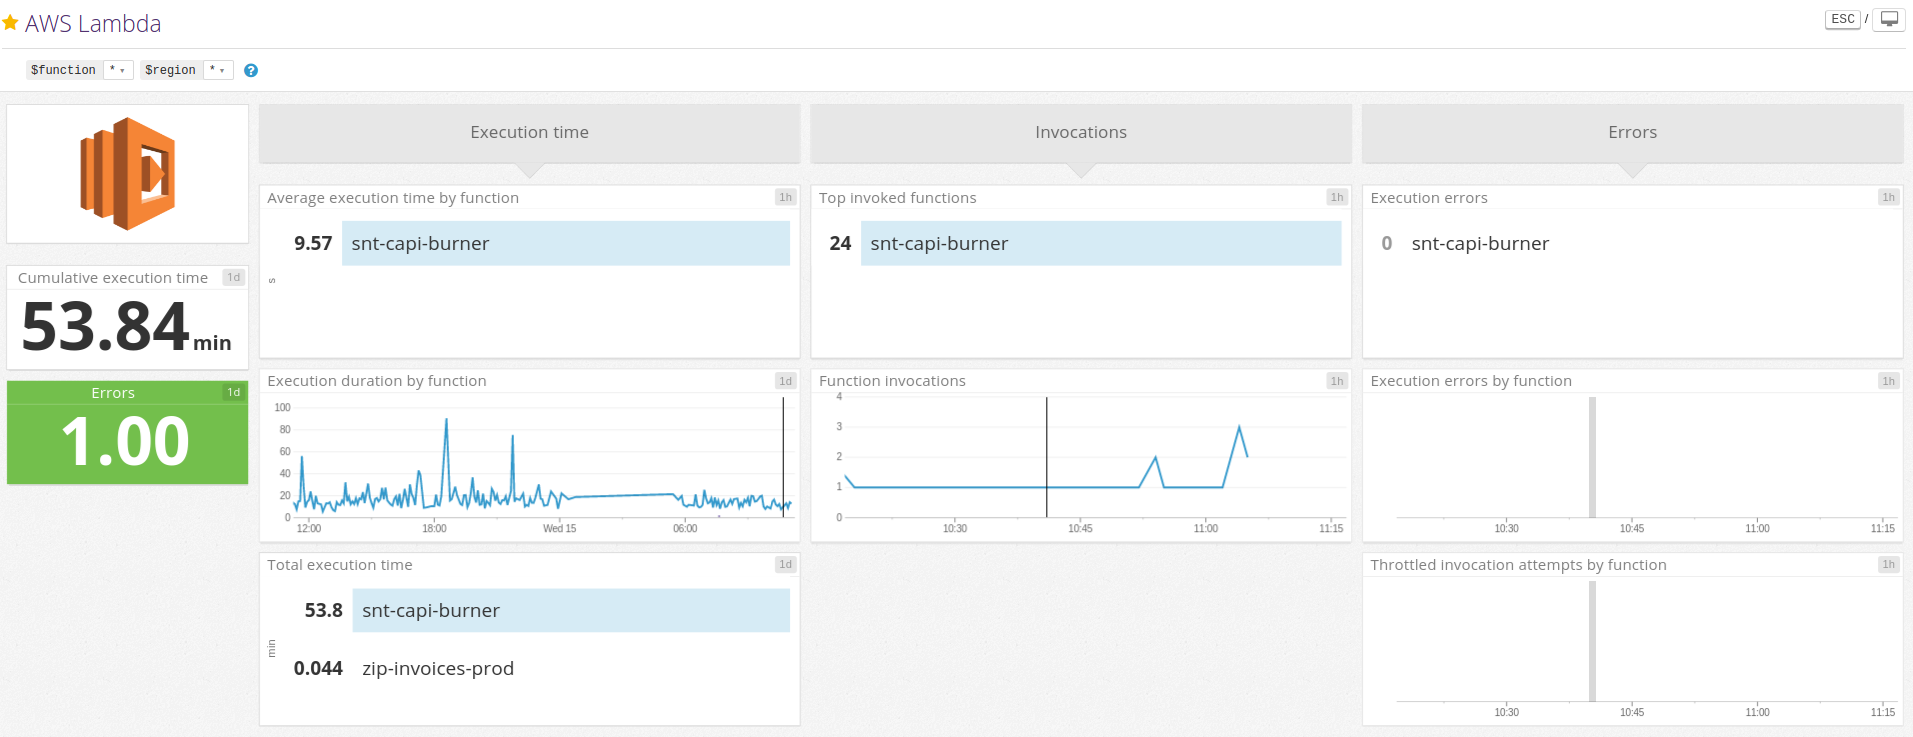
In order to monitor the entire system, our team uses the Datadog tool heavily. It is no surprise that Datadog provides integration with AWS Lambda. However, there is one configuration step needed to see Lambda metrics in the predefined Datadog dashboard, see screenshot below. This integration requires the permissions “logs:DescribeLogGroups”, “logs:DescribeLogStreams”, and “logs:FilterLogEvents” to access all features. They must be added to Datadog user used for integration purpose.
Datadog integration allows for custom metrics. To do this you must print a log line from your Lambda, using the following format:
MONITORING|unix_epoch_timestamp|value|metric_type|metric.name|#tag1:value,tag2
Below you can find an example of custom metric printed out from our function – it informs us that one step inside the function had been repeated.
MONITORING|1489573717917|0|count|aws.lambda.snt-capi-burner.retry|#env:prod
Once this line is processed by Datadog it becomes a regular metric which can be visualized in a chart, see the example below – the chart on the right.
Purple bars = custom metric. Green bars show function invocations – the regular metric that comes from Lambda.
Conclusion
After a short time of using the Lambda function, I think I can share some thoughts about it.
My overall impression about Lambda service is positive and I can see benefits coming from the implementation of that approach. It is a good complement to the microservice architecture.
In our case, we had no problems with Lambda infrastructure since the day one. Of course, after successful configuration. We had some issues to solve but all of them were caused by our mistakes in the function’s code.
Pros:
- Simple concept – flat learning curve
- Build time – in most cases
- Out of the box ability to scale up
- Costs – however, it depends on the specific case: number of requests, consumed resources etc.
- Wide range of possible event sources
- Reduced maintenance effort
- Support for the most popular programming languages: Java, Javascript, Python, C# just to name a few
Cons:
- Permissions – this applies to functions that use other AWS services like S3, SNS etc. On the other hand, similar configuration must be applied in case of EC2 based solutions
- Network configuration – especially when the function must have access to internal and external services[5]
- Cumbersome troubleshooting – because we cannot attach a debugger to a running function instance, good unit tests are needed and the ability to test the function without the real execution environment, for example: in a local machine
- Monitoring – but it is good enough and it is improving over time
I highly encourage you to read more about serverless architecture. It is gaining popularity and it may suit your needs as well.


